metrics

API details.

PCK

 PCK (pts:<built-infunctionarray>, gt_pts:<built-infunctionarray>,
      ths=array([ 0,  1,  2,  3,  4,  5,  6,  7,  8,  9, 10, 11, 12, 13,
      14, 15, 16,        17, 18, 19]))

Function to calculate Probability of Correct Keypoint (PCK) given the error threshold


get_mAA

 get_mAA (mAE:<built-infunctionarray>, ths=array([ 1.        ,
          1.39495079,  1.94588772,  2.71441762,  3.78647901,
          5.2819519 ,  7.368063  , 10.27808533, 14.33742329, 20.
          ]))

get_visible_part_mean_absolute_reprojection_error

 get_visible_part_mean_absolute_reprojection_error (img1_shape,
                                                    img2_shape, H_gt, H)

We reproject the image 1 mask to image2 and back to get the visible part mask. Then we average the reprojection absolute error over that area

Calculates PCK Probability of Correct Keypoint given the error threshold

import matplotlib.pyplot as plt
gt = np.stack([np.arange(5), np.arange(5)], axis=-1)
pts = np.array([[0,0],
               [1,1.1],
               [2,3],
               [2.5,2],
               [4.1,6]])
plt.plot(gt[:,0], gt[:,1], 'go', label='GT')
plt.plot(pts[:,0], pts[:,1], 'rx', label='estimate')
plt.plot(np.stack([pts[:,0], gt[:,0]], axis=0), 
         np.stack([pts[:,1], gt[:,1]], axis=0), 'r-', label='error')


plt.legend()
ths =  np.arange(4)
acc = PCK(pts, gt, np.arange(4))
plt.figure()
plt.plot(ths, acc, '-x')
plt.ylim([0,1.05])
plt.xlabel('Thresholds')
plt.ylabel('PCK')
plt.grid(True)


fraction_of_gt_corrs_consisent_with_F

 fraction_of_gt_corrs_consisent_with_F (Fm:<built-infunctionarray>,
                                        gt_corrs:<built-infunctionarray>,
                                        ths=array([ 0,  1,  2,  3,  4,  5,
                                        6,  7,  8,  9, 10, 11, 12, 13, 14,
                                        15, 16,        17, 18, 19]))

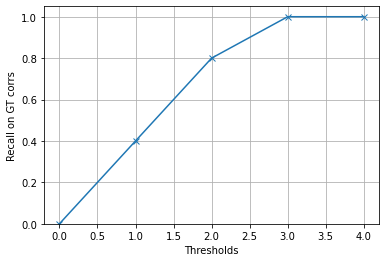
Calculates percentage of the ground truth correspondences, consistent with estimated fundamental matrix in a sense of the symmetrical epipolar distance. This is evaluation from the WxBS paper, see the screenshot below: image.png

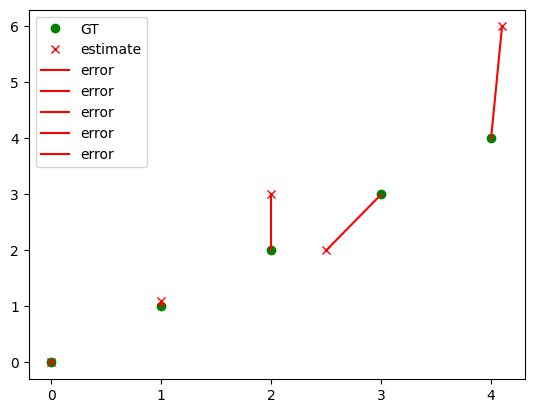
pts1 = np.stack([np.arange(5),
               np.arange(5)], axis=-1)
pts2 = np.array([[0,0],
               [1,1.1],
               [2,3],
               [2.5,2],
               [4.1,6]])
corrs = np.concatenate([pts1, pts2], axis=1)
# Generate F for the purely horizontal shift between the cameras 
F = np.array([[0.0, 0.0, 0.0],
              [0.0, 0.0, -1.0],
              [0.0, 1.0, 0.0]])
ths = np.arange(5)
recall = fraction_of_gt_corrs_consisent_with_F(F, corrs, ths)
plt.figure()
plt.plot(ths, recall, '-x')
plt.ylim([0,1.05])
plt.xlabel('Thresholds')
plt.ylabel('Recall on GT corrs')
plt.grid(True)
/opt/homebrew/Caskroom/miniforge/base/envs/python39/lib/python3.9/site-packages/ipykernel/ipkernel.py:283: DeprecationWarning: `should_run_async` will not call `transform_cell` automatically in the future. Please pass the result to `transformed_cell` argument and any exception that happen during thetransform in `preprocessing_exc_tuple` in IPython 7.17 and above.
  and should_run_async(code)